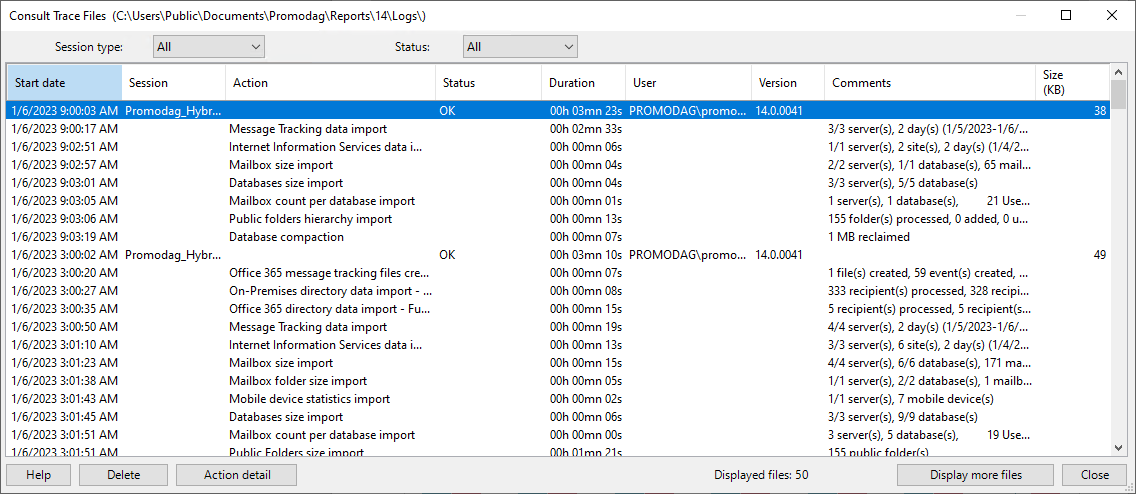
The purpose of this option is to view the content of trace files generated during interactive and batch processes. Each batch execution is recorded in a session. A new session is created every time the application is started. The list is sorted by session date in descending order.
| Column header | Description |
|---|---|
| Start date | Date when the session started. |
| Session | Type of session:
|
| Action | Name of the taken action. One single session may include several actions. |
| Status | Session/action status:
|
| Duration | Total duration of the session/action. |
| User | User account of the user who initiated the action. |
| Version | Version of Promodag Reports. |
| Comments | Comment (in black),warning (in blue) or error (in red) message. |
| Size | Size of the trace file. |
Note: Information contained in this window may be filtered by session type and by status.
The following options are also available:
| Option | Description |
|---|---|

|
Click this button to delete the selected trace file. |

|
Click this button to view a report of the selected operation (or double-click it). |

|
Click this button to display another set of 20 trace files (only the 20 first files are displayed by default). |
For more information about trace files, see Troubleshooting material.