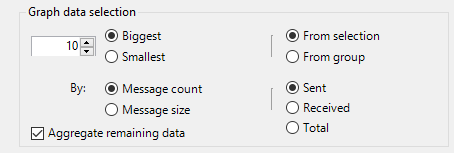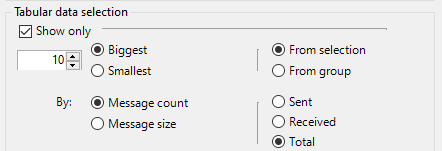
Compose the content of the graph to display in the report.

| Option | Selection |
|---|---|
| [Number], Biggest, Smallest | Enter the number of entries to be displayed in the report. For example, enter 10 and select the Biggest radio button if you wish to obtain a top 10 of the largest mailboxes in the selection/group. |
| From selection | Select this radio button to obtain a top n of all items selected in the Selection tab. |
| From group |
Select this radio button to obtain a top n for each group selected in the Group tab. For example, you will obtain a report showing 30 mailboxes
|
| Aggregate remaining data | Select this check box to display the cumulated number/size of messages that are not part of the top n. |
| By: Message count, Message size, Sent, Received, Total | Select these radio buttons to choose the type of traffic data and the traffic direction to be displayed in the report. |
Note: this graph will only appear if you select the Graph or Graph & Tabular data options in the Presentation tab.
Compose the content of the table to display in the report.

| Option | Description |
|---|---|
| Show only | Select this check box to display a top n. |
| [Number], Biggest, Smallest | Enter the number of entries to be displayed in the report. For example, enter 10 and select the Biggest radio button if you wish to obtain a top 10 of the largest mailboxes in the selection/group. |
| From selection | Select this radio button to obtain a top n of all items selected in the Selection tab. |
| From group |
Select this radio button to obtain a top n of each group selected in the Group tab. For example, you will obtain a report showing 100 mailboxes
|
| By: Message count, Message size, Date, Subject, Recipient count, Sent, Received, Total | Select these radio buttons to choose the type of traffic data, and the traffic direction to be displayed in the report. |
Note: this table will only appear if you select the Tabular data or Graph & Tabular data options in the Presentation tab.
Select the primary sort key and the sort order to apply to the report.

| Option | Description |
|---|---|
| Message count | Select this radio button to sort mailboxes by number of sent, received or total messages (smallest to largest if Ascending, largest to smallest if Descending). |
| Message size | Select this radio button to sort mailboxes by size of sent, received or total messages (smallest to biggest if Ascending, biggest to smallest if Descending). |
This option determines whether a message sent to n recipients is counted as 1 message sent or n messages sent.

| Option | Description |
|---|---|
| Once | Select this radio button to count a multiple sending as one message.For example, if Mailbox A sends 1 message to Mailbox B, Mailbox C and Mailbox D, Promodag Reports counts this message once. |
| n times | Select this radio button to count a multiple sending as n message. For example, if Mailbox A sends 1 message to Mailbox B, Mailbox C and Mailbox D, Promodag Reports counts this message three times. |
For additional information on this feature, see How is traffic calculated.