To illustrate the configuration method of a report, we are now going to run a sample report and try to address the following question: Who sent the most messages to Internet last week?
Our detailed requirements are to analyze last week's email Internet traffic for all mailboxes in our organization, and to get a report showing the top 5 senders, by number of sent messages, by department in our company.
Activity level of a group of mailboxes in a given period can be analyzed with to the Mailbox by Traffic Level report template. This template uses message tracking files imported into the database as data source.
In the Templates menu, select Mailbox Traffic and then Mailbox by Traffic Level to open the report template option dialog box.
This dialog box includes a variety of tabs. Many of them are common to all reports. We are going to review them one by one and configure them in order to obtain the report that meets our requirements.
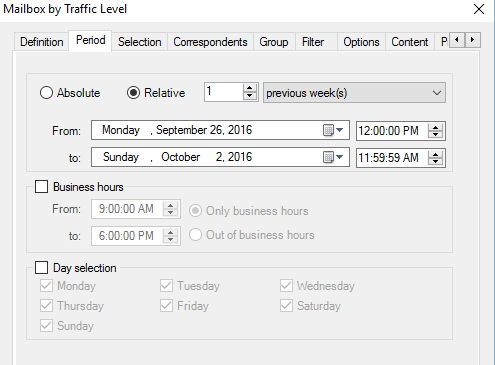
The Period tab allows to select a specific reporting period. It is possible to select an absolute or relative date range as well as particular days of the week. You can also focus on business hours.
We want to analyze last week's email traffic.
Note: Make sure that message tracking files covering this date range have been imported.
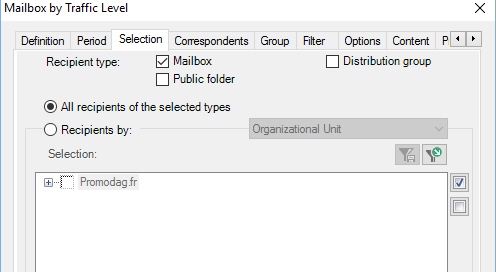
The Selection tab allows to select the group of directory objects (mailboxes, public folders, servers...) on which Promodag Reports is going to report. For example, mailboxes can be selected using common AD attributes such as Company, Department or OU.
We are going to analyze the whole of our Exchange organization's mailbox traffic.
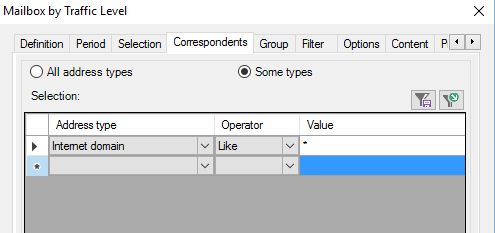
Use the Correspondentstab to select correspondents by attribute. For example, you may want to select them by correspondent type, such as 'internal', and by SMTP domain.
We are interested, in this particular case, in displaying outbound message traffic (to Internet).
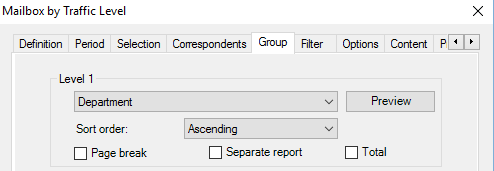
The Group tab allows to group your selection of recipients by attribute at up to 3 levels. For instance, you may want to group the mailboxes you selected by Company at level 1, by Department at level 2, and by Office at level 3.
We have decided to group our organization's mailboxes by department.
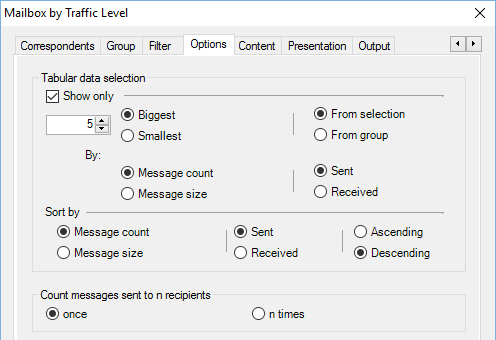
The Options tab allows to select various sorting options in the report template.
We have chosen to only display the top 5 email senders of each department and we would also like to sort results by number of sent messages.
Note: Selecting the From group option allows the report to display the top 5 senders for each department, while the From selection option would retrieve the top 5 senders for all organization mailboxes.
Sort by option:
The list can be sorted in ascending or descending order. We want to sort results by number and by descending order.
A message sent to n recipients is counted as 1 sent message or n sent messages. You can only select one of these two options.
We want to count each sent message once.
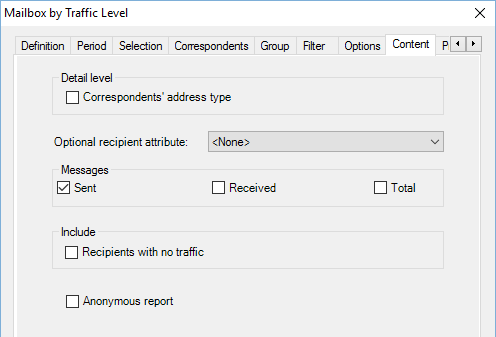
The Content tab allows to select the detail level of the final report, and the direction of the traffic (Sent, Received).
| Option | Description |
|---|---|
| Correspondents' address type | Check this box to display the address type in the report, e.g. Exchange or Internet. |
| Optional mailbox attribute | Select one directory attribute related to mailboxes, such as their SMTP address (Email address), to display in the report. |
| Messages | Choose the direction of traffic to display in the report: Sent messages, Received messages, and/or Total. |
| Mailboxes with no traffic | Check this box to display all selected mailboxes including those with no traffic during the chosen period. |
| Anonymous report | For confidentiality reasons, you may select this check box to replace mailbox names by an anonymous label followed by a counter (Mailbox 1, Mailbox 2 etc.). |
We only want to display sent messages.
The Output tab allows to choose the output destination and the format of your report.
Reports can be displayed on screen or exported under various formats.
We wish to output this report to screen.
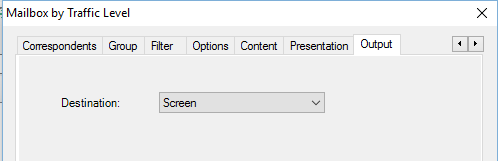
Should you need to automate a report by including it in a batch file, you will have to select another destination than Screen in the Output tab, e.g. Disk file or Email recipient. Screen output is not available for automated reports.
Once all report options have been set, click Run report to generate the report. Promodag Reports retrieves the information it needs in the database and queries it to produce the requested report. The report appears in a preview window.
This report displays the top 5 senders to Internet by department sorted by number of messages sent.
This previewed report can be printed or reloaded ( or
or  buttons), but also exported or saved for later use.
Click the  button to export the report (or use the File > Export Report option).
Reports may be exported under various destinations (disk file, email recipient, Exchange folder or SharePoint), and under different formats (RPT, CSV, XLS, HTM, PDF, RTF or MHT).
For more information about file destinations and formats, see Previewing, exporting, publishing and e-mailing reports .
Click the  button to save your report options in a file, or to save a 'snapshot' of your report.
Select Save Report Options to save your options in a file.
A Promodag Reports options file is a text file containing options for a custom report. Report options files contain a whole set of options for a given report, e.g. date, server, sorting order... The report option file extension is .pro.
For the default location of option files (.pro), see: Default paths for installation and settings.
This file can be
This menu lists custom reports options files (or favorites) delivered as samples with the product.
These canned reports are organized in four categories:
Each of these favorites answers a question, for example: How many messages were sent to Internet in the last 7 days in the Traffic Analysis and SLA Reporting group.
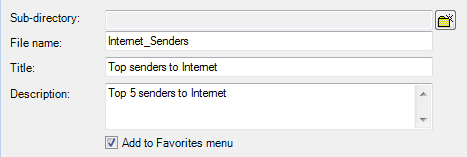
You can add new entries to this menu yourself by selecting the Add to Favorites menu option when saving your custom reports, or even add your own categories by creating new sub-folders into the \Batches folder. For more information about custom reports, see Saving custom reports.
For more information about default paths for installation and settings, see Default paths for installation and settings.
In this last case, we recommend that you give it a meaningful name such as Top senders to Internet. This will make it easier to locate the report options file in the Favorites menu.
Select Save Report Snapshot to save a still image of the active report as a *.rpt file. It will be viewable using the My Snapshots menu.
This option may be handy if you need to quickly save your report 'as is', and then export it later on. For example, you can save your report as a snapshot, export it today as a *.csv file, and decide next week that you will also export it as a *.pdf file attached to an email that will be sent to a dozen recipients (there is no need to use an email client: simply select the Email recipient destination).